


Few of the early maps are to scale but they will still be able to confirm where our ancestors lived and worked. You may even be able to ascertain what the construction of their house was.

Why maps are useful

A map may help add to our knowledge of local events and be able to see how a town or village developed over the years. Just something simple like comparing a map from the 1800s with one a hundred or so years earlier will show the impact of development and how that may have affected our ancestors' daily lives.

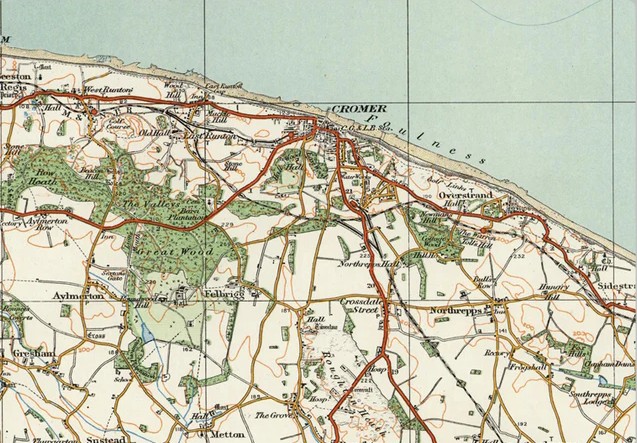
The most useful and informative scale maps for family history research are the Ordnance Survey maps, frequently used for such projects as railway development and road construct'ion. They can also tell us a great deal about the area that was home to our ancestors.

Today you do not have to look far as many have been digitised and are available online, but nothing will beat a visit to local archives to look at originals and identify the less common maps which may contain a gem. Government departments and local authorities also produced maps and plans for many different reasons including housing schemes, public works, and enclosures.

History of maps

It is believed that one of the oldest map of the British Isles dates from around 1375 and is known as the Gough Map which depicts routes and marked distances making it unique in British mapping prior to the seventeenth century.

This map like many other early maps was created for travellers, identification of personal or religious estates and perhaps even for early military use. Most surviving early maps date from the 1500s when maps began to be produced commercially. Saxtons' County Maps were available from the 1570s. Many other maps were produced over the next couple of centuries, but it was not until the 1700s that town and city maps became popular.

During this time there were many privately funded and produced maps which do not prove very useful as they are not to scale and do not always contain much detail so may not include all properties. The first true-to-scale Ordnance Survey maps were produced in the mid-1700s

Development of Ordnance Survey maps

Ordnance Survey as a mapping agency has its origins in the military as it mapped the Scottish Highlands following the 1745 Jacobite rebellion.

During the French Revolution there were fears the war might reach our shores, so the government ordered the Board of Ordnance to survey England’s southern coasts.

Mapping started in 1747 and took eight years to complete. The Great Map was at a scale of 1:36 000 equivalent to 1.75 inches to a mile. All topographical information was recorded. The survey was carried out by parties of eight and relied on simple surveying compasses to measure angles and chains fifty feet long to measure distance between important features.

William Roy, a general in the Royal Engineers, was largely responsible for the starting point of the Principal Triangulation of Great Britain between 1783 and 1853; this then led to the creation of the Ordnance Survey itself. Work really began in 1790 when the Board of Ordnance began the national military survey.

In 1801, the first one-inch-to-the-mile map was published starting with the county of Kent followed by Essex shortly afterwards. The Essex maps were published by the Ordnance Survey and ignored the county border, whereas the Kent map was privately published.

During the next twenty years around a third of the country was mapped at the same scale, although by 1810, maps of most of the south of England were complete. By 1840, the one-inch ordnance survey maps covered Wales and some counties of northern England.

In 1855, the Board of Ordnance was disbanded and the Ordnance Survey became part of the War Office combining with the Topographical Survey and the Depot of Military Knowledge, both eventually transferring to the Office of Works.

The primary triangulation of the United Kingdom was completed by 1841 but was greatly improved in 1858. The Tithe Act 1836 led to a six-inch to the mile survey in England and Wales. This and the development of the railways resulted in the Ordnance Survey Act 1841 which granted a statutory right to enter property for the purpose of the survey.
New headquarters

Following a fire at its headquarters at the Tower of London in 1841, the Ordnance Survey relocated to a site in Southampton. The Director General saw how photography could be used to easily make maps of various scales by developing photozincography used to publish facsimiles of nationally important manuscripts. A facsimile of the Gough Map was issued in 1870.

County series of maps

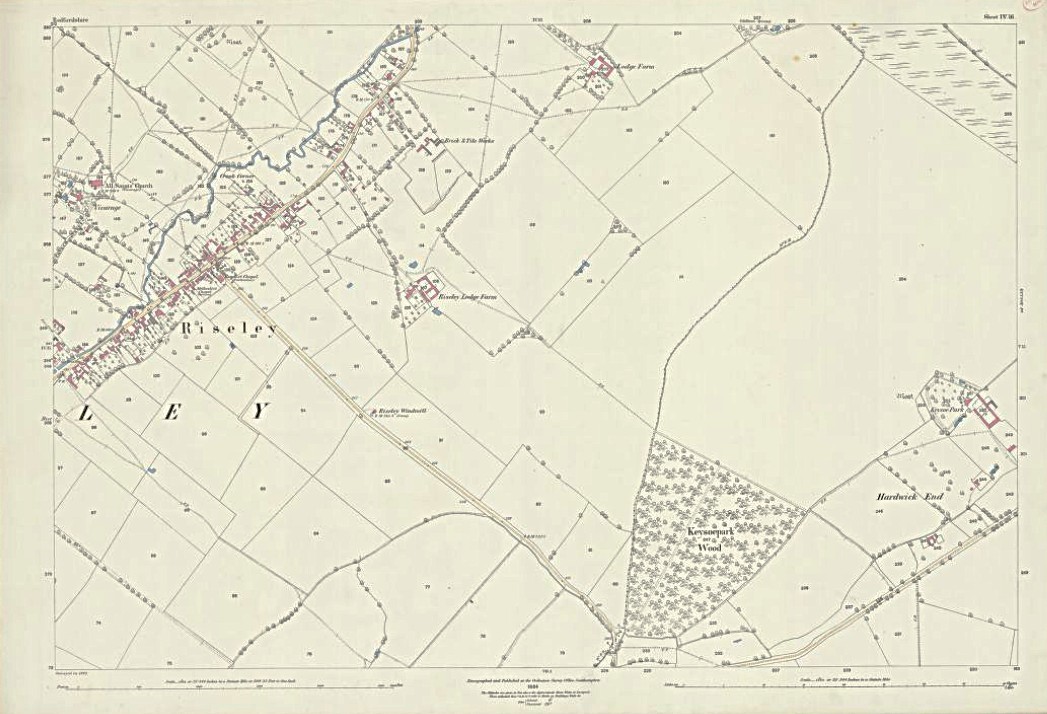
From the 1840s, the Ordnance Survey concentrated on producing the County Series of maps by mapping the country, county by county, at a scale of six inches to the mile.

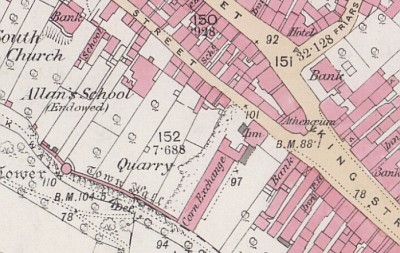
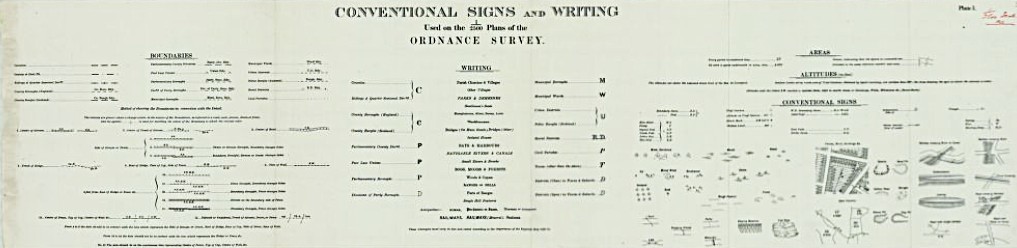
In 1854, twenty-five inch maps were introduced with a scale of 1:2500 and the six-inch maps were thereafter based on the twenty-five-inch maps. The first edition of these maps was completed by the 1890s, with a second edition completed in the 1900s. Publication of the popular one inch to the mile series for Great Britain was completed in 1891.

The Ordnance Survey also produced many restricted versions of the County Series maps for the War Office in a variety of scales which included details of dockyards, naval installations, fortifications and military camps. The War Department 1:2500 maps were contoured. They helped to complete the map-picture of pre-Second World War Britain.

City and town mapping

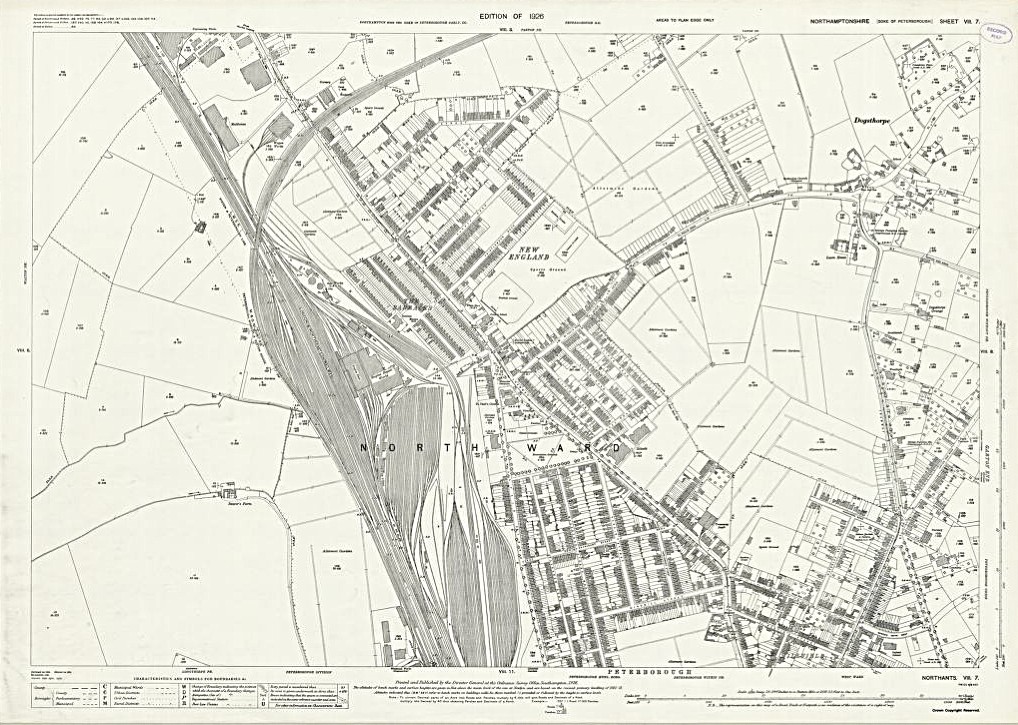
From 1840, the six-inch scale was adopted in Great Britain and the 1:1056 scale was adopted for urban surveys. Between 1842 and 1895, some 400 towns were mapped at 1:500 with the remaining towns mapped at 1:2500.  The 1:1056 sheets were partially revised to provide the Land Registry index maps

Once Great Britain was successfully mapped, the Ordnance Survey sent their surveyors to Ireland to continue the project.

Retriangulation and trig points

After the First World War, everyone wanted a map. There was a huge boom in hiking, cycling and outdoor activities. People started to think of maps as essential. So in 1935, it was decided to do the whole triangulation process again to make even better maps. The Retriangulation of Great Britain was launched with a permanent reminder of the triangulation process, the birth of the trig point or, to give them the correct name, the triangulation pillar. Over 6000 of these were built across the country. They were designed to house the surveyors’ theodolites and painted white to make it easier to line up the angles. At this point Ordnance Survey launched the national grid system.

Features of map scales

Map Scales - The 6-inch-to-the-mile maps (1:10,560) show rural landscapes with incredible detail, while 25-inch maps (1:2,500) provide in-depth detail for urban areas and land ownership. Many online maps are now "georeferenced," allowing them to be superimposed over modern maps.

As well as producing maps, the Ordnance Survey was responsible for the Public Boundary Archive for Great Britain. Its files show each change to a county, parish, parliamentary and local government boundary. There are large numbers of Ordnance Survey reports and other files describing and defining boundaries. They include:

Local government area boundaries 1852-1936

Poor Law Union boundaries 1820-1940

County boundaries

Ordnance Survey (OS) maps from the nineteenth and early twentieth century are essential for family history research allowing researchers to visualize ancestors' homes, workplaces, and neighbourhoods.

Locating Homes: Identify precise locations of homes listed in census records and locate churches, workplaces, schools and railways. The route of disused railways lines can also often be seen on the modern map.

Place names: you have found in the records will become a reality as will farm names and landed estates enabling you to form an impression of the character of the villages and towns which affected your ancestors' lives.

Churches and chapels: are denoted by different symbols depending on whether they have a tower, a spire or neither. The original church would occupy a dominant position. Places of worship without a spire or tower are more likely to be later and to be nonconformist chapels.

Town and village expansion: You can see housing patterns and how buildings are spaced and laid out. Discover if they were they next to industrial areas, sewage works and other potentially undesirable features or in suburbia with larger gardens. You will also be able to determine if streets were extended enabling you to approximate the construction date of your ancestor’s house.

Landowners sold off fields so you can clearly see the old field boundaries preserved in newer housing estates. In rural areas, fields are still shown on the map as well as paths and tracks and names of many of the smaller farms are shown.

You can also find evidence of old quarries for stone, sand, lime and other materials which may relate to the occupations listed for your ancestors.

Where to find Ordnance Survey maps

The best free, high-quality online resource for old Ordnance Survey (OS) maps is the National Library of Scotland maps website, which provides extensive georeferenced maps for England, Scotland, and Wales in various editions from the 1840s to 1950s. Another excellent free source is A Vision of Britain Through Time.

Past Map focuses on Scottish maps allowing you to overlay historic OS maps onto modern map bases to see the changes that have occurred over time.

There is a large range of reprints of OS maps available from Family History Books Online which is part of the Family History Federation.  These affordable reprints are accessible, usable and inexpensive. 

Visit https://www.familyhistorybooksonline.com/england-458.   There are links for other home countries.

This article was contributed by Ian Waller from Family History Federation.
Website by Beachshore