Bomb census maps exist for the whole of the London Civil Defence Region; there are fewer for other provincial towns and cities.
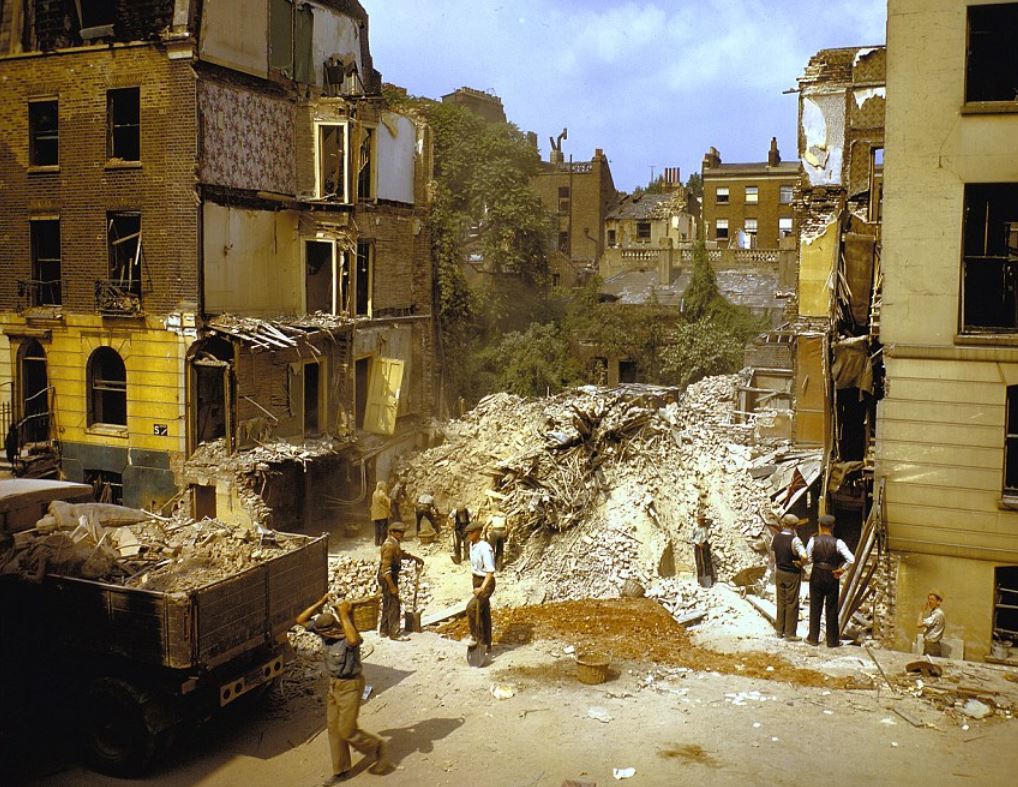
The maps provide a unique collection which were coloured by hand and reveal the extent of the destruction in detail. They are a valuable resource to family and local historians whose families were bombed out during the war.
They have also been invaluable for bomb disposal experts where unexploded bombs have been located. The colouring applied to the maps records a scale of damage and are the most detailed and complete survey of destruction caused by aerial bombardment.
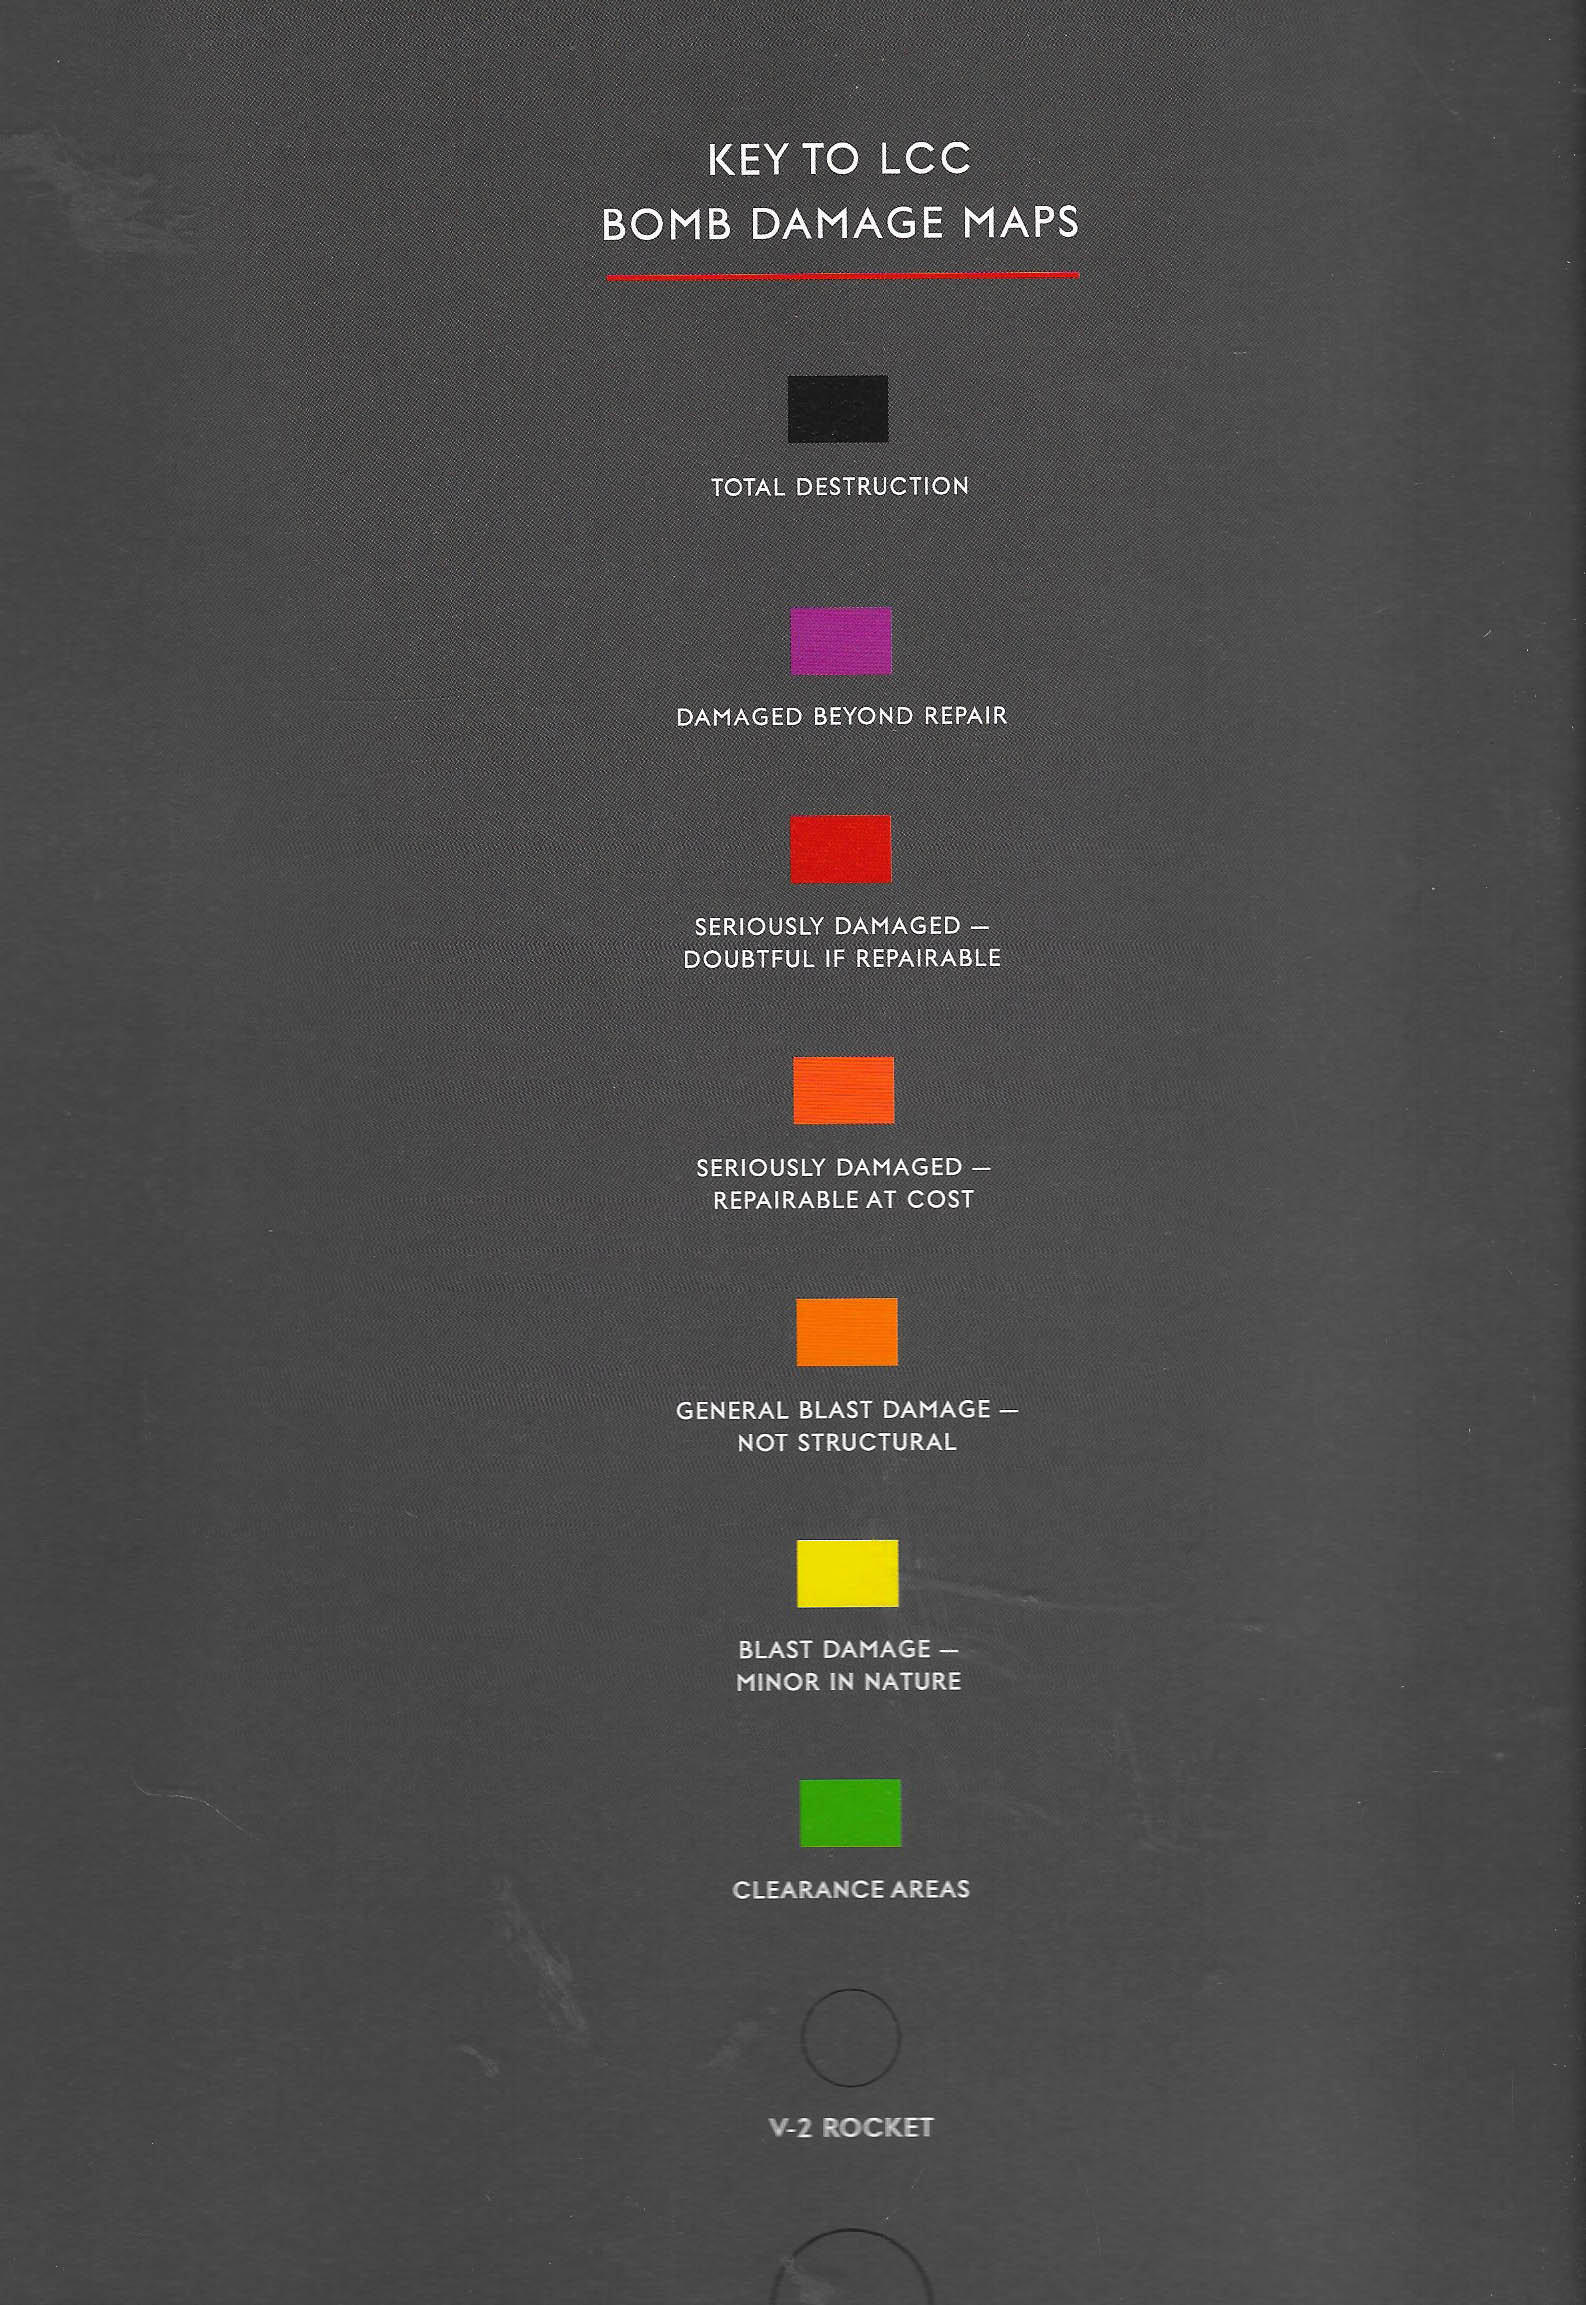
The colour coding on the maps is as follows:
Black - total destruction
Purple - damaged beyond repair
Dark red - seriously damaged, doubtful if repairable
Light red - Seriously damaged, but repairable at cost
Orange - general blast damage, not structural
Yellow - blast damage, minor in nature.
The maps also illustrate where the impact points were for V-1 flying bombs and V-2 long-range rockets; these are depicted by either large or small circles.
Besides the damage shown by the above colours, there are areas shaded in light blue. These are the areas cleared by the War Debris and Demolition Service. On some maps, aqua is used. However, be aware that parks and open spaces were also coloured in pale green and lakes in pale blue so make sure you examine the maps closely in order to correctly interpret what they are showing.